It is 2:00 AM on a Sunday. Your monitoring system alerts start firing. A critical Java service is completely unresponsive. The load balancer is throwing HTTP 504 Gateway Timeouts, API request queues are backing up, and user traffic is starting to fail. You shell into the server and tail the logs—they have completely stopped moving. The JVM is hung in production.
In the heat of a production outage, the natural instinct of many operations teams is to immediately restart the application to restore service. However, restarting the JVM without capturing diagnostic data is like washing away a crime scene. The immediate pressure is relieved, but the underlying issue remains a mystery, guaranteeing that the exact same bug will return to haunt you tomorrow. This guide outlines a systematic, step-by-step production incident response playbook to diagnose a hung JVM under pressure before safely restarting the service.
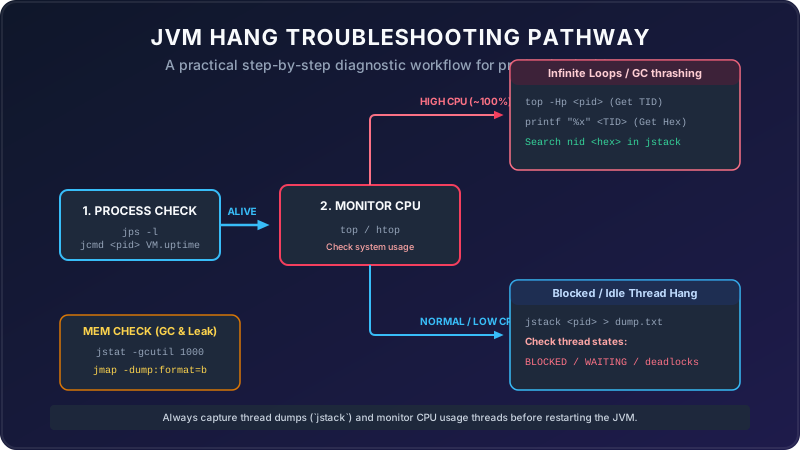
When a server environment stops processing incoming API requests, the deadlock or freeze typically manifests in one of two distinct patterns:
- The Hamster on a Wheel (High CPU): The processor is running at 100% capacity, yet no real work is getting done. This is usually caused by an infinite loop in the application code, or severe Garbage Collection thrashing where the JVM spends all of its compute cycles trying to reclaim tiny fractions of memory.
- The Sleeping Guard (Low or Normal CPU): The system is sitting completely idle, consuming virtually zero CPU. In this case, the threads are blocked—either waiting on a database connection pool, starved for external API socket responses, or locked in a mutual dependency deadlock.
Step 1: Isolate the Affected Instance (Mitigate User Impact)
Before executing diagnostic commands, you must stop the user impact. Your primary goal is to isolate the broken instance without destroying the diagnostic evidence in the heap and call stack:
- Drain Traffic: Remove the failing node from the load balancer rotation, route traffic away in your API gateway, or modify Kubernetes service discovery tags to stop new requests from hitting the instance.
- Keep the Process Running: Do not terminate, reboot, or kill the container. Keep the VM active so that you can attach diagnostics tools and inspect the frozen memory state.
Step 2: Check Whether the JVM is Responsive
Before diving into deep dumps, confirm if the Java process is actually running on the server and check if the runtime environment is responsive to basic administrative command-line tools.
First, list the active Java processes using jps (Java Process Status Tool) or a standard ps command to identify the process ID (PID):
# Find the Java Process ID (PID)
jps -l
# Or alternatively on generic Linux:
ps -ef | grep java
Once you have the <pid>, check if the JVM is responding to basic commands by querying its uptime. If this command hangs or fails, the JVM is completely frozen (often due to kernel locks or a heavy Stop-the-World GC pause):
# Check JVM Uptime
jcmd <pid> VM.uptime
Step 3: Capture Thread Dumps (Take 3–5 Snapshots)
Thread dumps show what every thread is doing, which locks are held, and which threads are waiting. Always capture multiple thread dumps spaced 5–10 seconds apart. This is crucial to distinguish between a thread that is completely blocked and a thread that is executing a very slow but progressive operation.
Using jcmd (recommended for modern JDKs):
# Capture thread snapshot
jcmd <pid> Thread.print > thread_dump_1.txt
# Wait 5 seconds, capture the second snapshot
jcmd <pid> Thread.print > thread_dump_2.txt
Using jstack:
jstack -l <pid> > thread_dump_1.txtIf the JVM process is completely unresponsive to standard Java utilities, send an OS signal (which forces the JVM to print a thread dump to its standard output log):
kill -3 <pid>Step 4: Check CPU and Memory Usage
Run standard OS-level monitoring tools to identify resource allocation. This will dictate your troubleshooting path (High CPU vs. Low CPU):
# Monitor system-wide CPU and memory
top
# Or htop if installed:
htop
Look at the %CPU and %MEM columns for your Java process. Also check if the host memory is exhausted, forcing the OS to swap memory page blocks to disk:
# Check physical memory allocation
free -m
# Monitor virtual memory state
vmstat 1 5
Step 5: Troubleshoot High CPU (Thread to Stack Trace Mapping)
If your JVM process is consuming ~100% CPU, it means one or more threads are stuck in an infinite loop or performing heavy calculations. Map the high-CPU OS threads back to Java lines of code:
A. Find the Stuck OS Thread ID
Run top with thread monitoring enabled to locate which specific thread IDs (TIDs) are pegging the CPU:
# List all native threads under the Java process
top -Hp <pid>
Identify the thread at the top of the list. Write down its decimal TID (e.g., 2458).
B. Convert the Thread ID to Hexadecimal
Java thread dumps index native thread IDs (nid) in hexadecimal. Convert your decimal thread ID using printf:
# Convert 2458 to hex format
printf "%x\n" 2458
# Outputs: 99a
C. Search Thread Dump for the Culprit
Open your thread dump and search for the hexadecimal native thread ID prefix (0x99a):
# Find the culprit thread in the dump file
grep -A 20 "0x99a" thread_dump_1.txt
This outputs the stack trace of the high-CPU thread, showing you the exact class name and line number executing the loop.
Step 6: Troubleshoot Low CPU / Normal CPU Hangs
If the CPU usage is near 0% but the application is hung, threads are waiting on resources (the Sleeping Guard scenario). Open your thread dump and check the thread states for the following signatures:
A. Database Connection Pool Exhaustion
If you see dozens of application threads in a WAITING state trying to acquire a connection from a pool (like HikariCP), your database pool is exhausted. Look for stack traces mentioning:
"http-nio-8080-exec-5" #25 daemon prio=5
  java.lang.Thread.State: WAITING (on object monitor)
    at com.zaxxer.hikari.pool.HikariPool.getConnection(HikariPool.java:169)
This means your API threads are waiting forever because database connections are not being released back to the pool (or the pool size is too small for the traffic volume).
B. Missing External API Socket Timeouts
If threads are in a RUNNABLE or SOCKET_READ state but aren't moving, they are likely waiting for an external HTTP server to respond. By default, many Java HTTP clients have infinite socket read timeouts. If the remote system hangs, your JVM threads hang forever.
java.lang.Thread.State: RUNNABLE
  at java.net.SocketInputStream.socketRead0(Native Method)
Step 7: Check for Java Deadlocks
A deadlock occurs when Thread 1 holds Lock A and waits for Lock B, while Thread 2 holds Lock B and waits for Lock A.
The jstack tool automatically scans for deadlocks. Scroll to the very bottom of your thread dump file. If a deadlock exists, Java will print it prominently:
Found one Java-level deadlock:
=============================
"Thread-1":
  waiting to lock monitor 0x00007f (object 0x0001, a java.lang.Object),
  which is held by "Thread-2"
"Thread-2":
  waiting to lock monitor 0x00007e (object 0x0002, a java.lang.Object),
  which is held by "Thread-1"
Step 8: Investigate GC Thrashing
If the JVM is spending 98% of its time doing GC and reclaiming less than 2% of the heap, it is thrashing. The application freezes because the JVM performs constant Stop-the-World collections, preventing application threads from executing. This eventually triggers: java.lang.OutOfMemoryError: GC overhead limit exceeded.
Run jstat to check the GC behavior in real time (capturing stats every 1 second):
# Monitor GC metrics
jstat -gcutil <pid> 1000 10
Look at the columns:
O(Old Generation occupancy %): Is it at 100%?FGC(Full GC count): Is it rapidly increasing?FGCT(Full GC time): Is the accumulator growing while the application remains frozen?
Step 9: Capture Heap Dumps for Memory Analysis
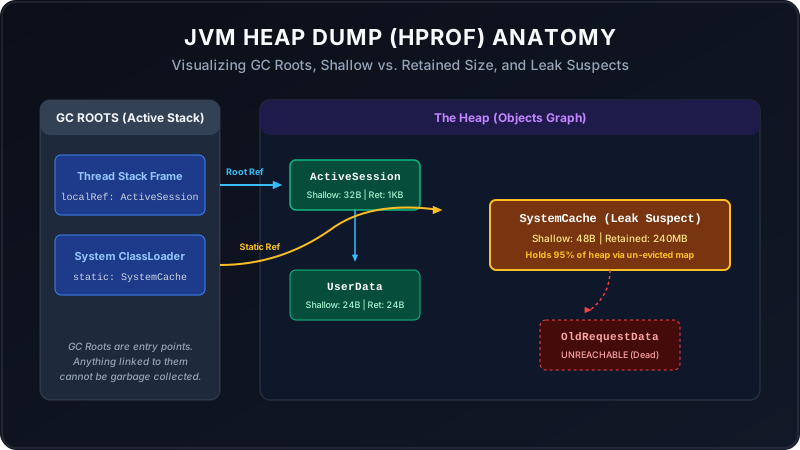
If the JVM is stuck in a GC loop or running out of memory, you must capture a heap dump to analyze which objects are filling up the memory (the warehouse audit).
Run jmap or jcmd to capture the heap snapshot:
# Capture heap dump (Warning: This will pause the JVM temporarily!)
jmap -dump:format=b,file=heapdump.hprof <pid>
# Or using jcmd:
jcmd <pid> GC.heap_dump /tmp/heapdump.hprof
Once downloaded, load the .hprof file into an analyzer tool like Eclipse Memory Analyzer (MAT) or VisualVM. Look for the "Leak Suspects" report to see if static collections, unclosed streams, or query caches are accumulating memory.
Step 10: Perform a Safe Service Restart
Once you have securely collected and verified all diagnostics (thread dumps, native CPU mappings, heap dumps), you can safely restart the application server to restore traffic and system health.
Section 11: External Resource Problems & Best Practices
A. External Resource Problems
A JVM can appear hung because of OS-level socket blockages. If the OS socket buffers are full, writing to output streams will block the thread.
Check the count of open sockets and their state connection records:
# Check TCP connection status
netstat -an | grep 8080
# Or using the faster ss command:
ss -s
If you see a massive count of connections in CLOSE_WAIT state, it means the remote client closed the socket, but your Java application failed to call close() on the socket stream, leaking file descriptors until the JVM ran out.
B. Spring Boot Actuator Debugging
When running Spring Boot microservices, you don't always need command-line tools to capture diagnostics. If you have enabled the Spring Boot Actuator, you can download thread and heap dumps securely over HTTP:
# Download Thread Dump as JSON
curl -X GET http://localhost:8080/actuator/threaddump > threaddump.json

# Trigger and download Heap Dump
curl -X GET http://localhost:8080/actuator/heapdump > heapdump.hprof
Make sure these endpoints are protected with spring-security in production so unauthorized users cannot access sensitive memory dumps!
C. Production Best Practices
To ensure you have the diagnostics when a hang occurs next time, configure your JVM with these fail-safe parameters in your startup script:
# JVM Startup Parameters for auto-diagnosis
java -XX:+HeapDumpOnOutOfMemoryError \
     -XX:HeapDumpPath=/var/log/jvm_dumps/ \
     -Xlog:gc*,gc+age=trace,safepoint:file=/var/log/gc.log:time,uptime,pid:filecount=5,filesize=100M \
-jar app.jar- HeapDumpOnOutOfMemoryError: Automatically captures the hprof file the moment memory runs out, saving the crime scene.
- GC Logging (-Xlog:gc): Writes a rotating trace of GC pauses and gen allocations to check memory history.
- Explicit Timeouts: Always configure connection and read timeouts on database pools (e.g.
connectionTimeout = 30000in HikariCP) and REST API clients (e.g. RestTemplate, WebClient).